My blog has been moved to GitLab, only old posts are shown at dingwell.github.io
Plotting wind vectors in NCL
A long day of banging my head against the screen…
NCL is such a handy toolbox to have, it can create ok-looking geographic plots with almost no work at all. It can also be used to create awesome, super specialized plots if you want it to…
(Rant-warning)
…as long as you’re ready to spend ours Googling through their website while trying to remember which attributes should be set in order to get things as you want. NCL is such a weird beast; you use it in order to save time and not have to think, but then you always end up wasting all that time by digging through scanty error messages, and looking up every single example file for at least ten different topics. I’ve spend so much time on their webpage, that I even have a quick command in my browser for googling NCL-related issues.
Why? you might ask…
- Because for some reason, if you Google NCL it takes you a cruising website which uses the same abbreviation. That and the fact the NCL website is nearly impossible to navigate and the search function never hits what you’re looking for.
(deep breath)
When everything works
NCL is actually quite good taking care of things out of the box, e.g. if you have output from the WRF-model there is a quick-tool for extracting wind data on the mass grid rotated to a latitude-longitude system. This requires a bit of work, first the wind components need to converted from their respective staggered grids (since WRF uses an Arakawa C-grid for computations and output) . Second, unless a standard longitude-latitude grid (or a Mercator grid) was used in the WRF-simulations, the wind components also need to be rotated from the projected grid to a latitude-longitude grid.
Using standard output from the WRF-model NCL will handle all of this on its own by running either of these commands:
uv = wrf_user_getvar(file_handle,"uvmet",time_index)
; dims:  t z y x
u = uv(0,:,:,:,:)
v = uv(1,:,:,:,:)
uv10 = wrf_user_getvar(file_handle,"uvmet10",time_index)
; dims:      t y x
u10 = uv10(0,:,:,:)
v10 = uv10(1,:,:,:)
Then you can use any of the gsn_csm-routines to plot your wind data, and it should be correct.
The problem
I got some WRF-data from another project where the output had been post-processed. Among other things, that involved the following:
- Header data had been split into a separate file; this included all dimension variables and all global attributes from the original files.
- The wind-data was stored on the mass-grid (not on the staggered u,v-grids), but the wind components were not rotated. Since NCL would have problems dealing with this configuration I decided to rotate the winds “manually”.
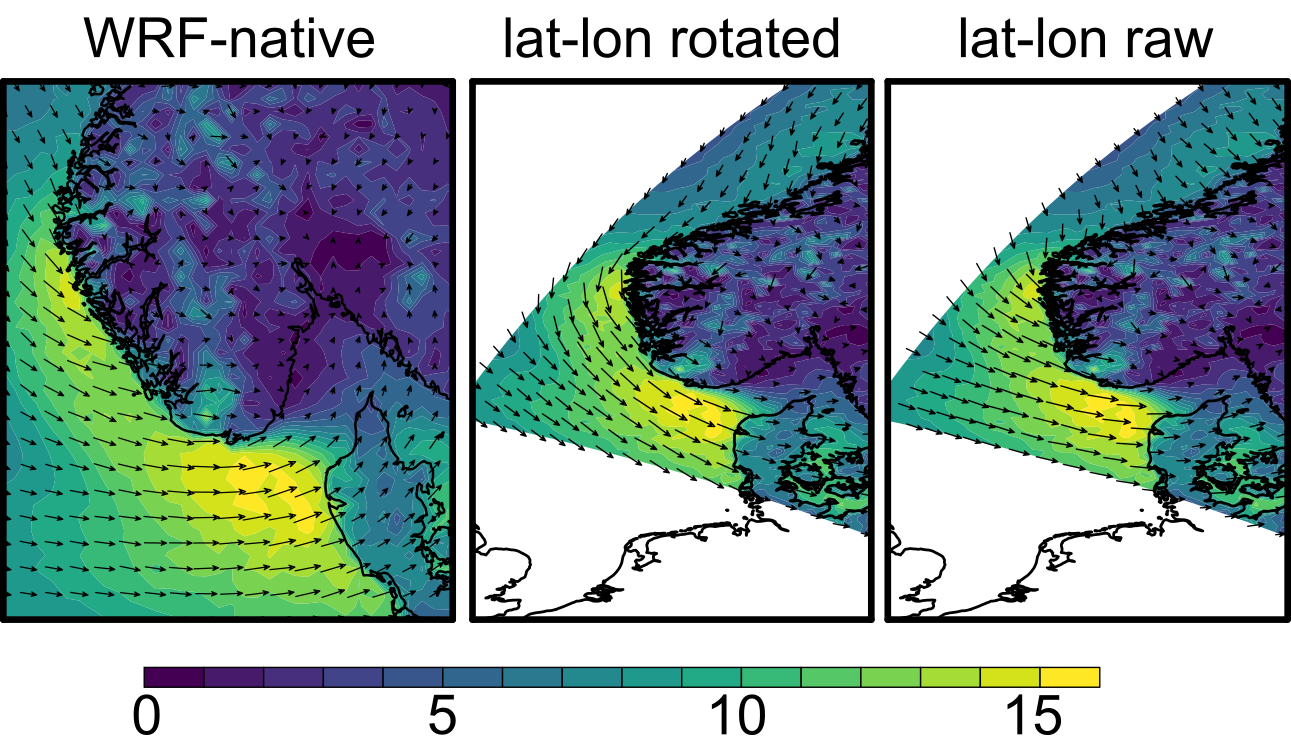
In order to ensure that I rotated everything correctly, I first plotted the data on the projected grid using gsn_csm-functions to create a basemap and overlay wind speed contours and wind vectors. I then created two plot on latitude-longitude maps, one with the initial wind-data and the other with the rotated data. This is what I got:
This is a subset of the domain I was working with, the left-hand figure shows the native WRF-grid which uses a Lambert Conical projection. Denmark is located down in the right-hand corner of the image and the image is centred over the south-west coast of Norway. The centre image shows roughly the same area but plotted on a latitude-longitude grid and with the rotation of wind components applied. The rightmost figure shows the same grid but with no wind rotation applied.
If no mistakes were made, then the first two images should show the same wind field, but they do not. In the WRF-native plot, you see the winds crossing the Norwegian coast, but in the latitude-longitude plot with rotated winds the winds are more parallel to the coast. Also notice the winds parallel to the domain boundary in the WRF-native plot, which is not present in the centre image. It seems like the rotation is doing more harm than good so something is obviously wrong, but what?
This is were todays frustration started, first, I went down the road of reading up on the numerous plot resources my scripts were using, no luck. Then I went on a long and desperate Google-pilgrimage until, finally, I stumbled in at (David Ovens’ website)[https://www.atmos.washington.edu/~ovens/wrfwinds.html]. He doesn’t say that much about NCL more than that it simply works, but he has some nice plots explaning the issues of wind component rotation. What I did was create a similar dummy wind field to what he did for his Python example. Then I quickly found the problem, and it’s embarrasingly simple.
The problem was that NCL is too clever and I should have realized this since I’ve had somewhat related issues previously. The big mistake was that I’d used the gsn_csm-functions for the WRF-native plot. NCL then assumes that the wind components are in a latitude-longitude system and rotates them back to the Cartesian grid you’re trying to plot (kind-of… it’s actually far more clever than that). This could have been easily avoided by sticking to the basic gsn-functions instead, which will completely skip all geographical “nonsense” and simply plot the data. But using the basic gsn-functions has other issues which I was trying to avoid. Most importantly, I wanted very similar code for each of the script I used to generate the three images so that I could quickly find bugs and discrepancies between the scripts.
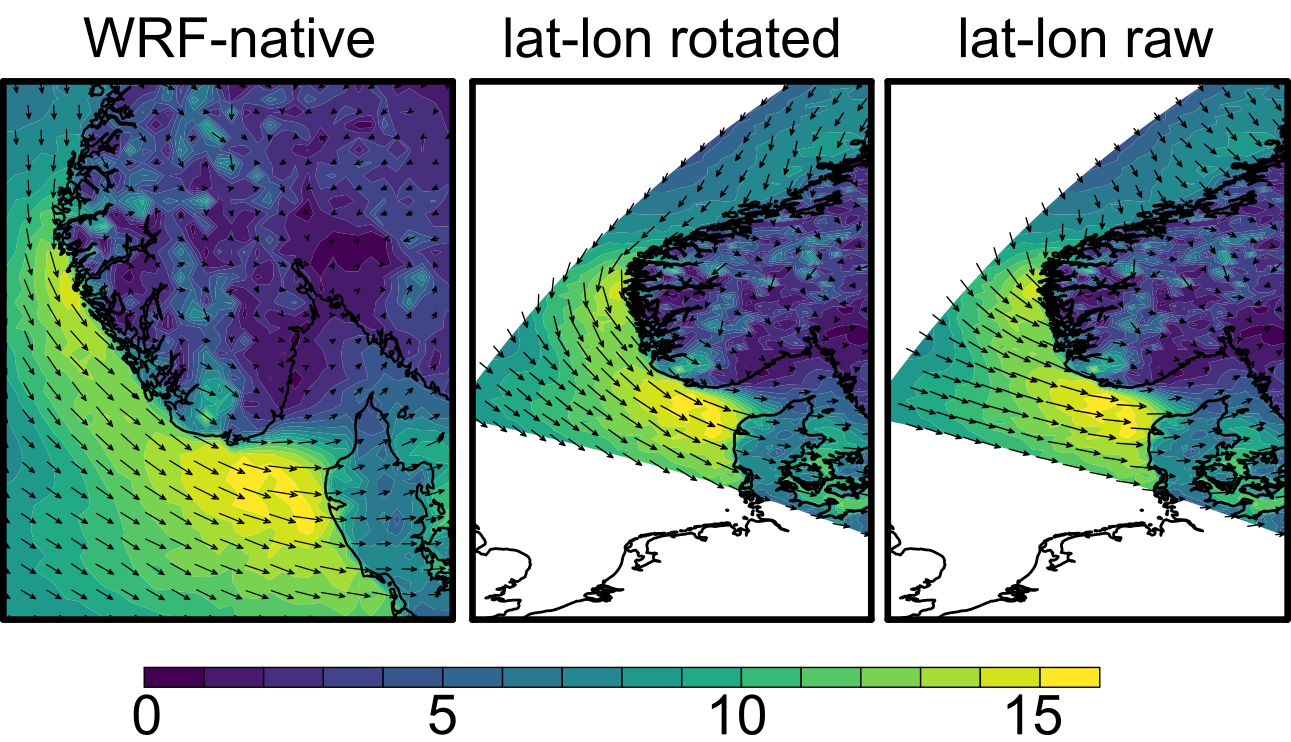
The solution (which is really as simple as the problem) is to rotate the winds before creating the WRF-native plot and stick with using the gsn_csm-functions. Doing that gives this set of images instead, which makes far more sense:
Same as above but with the correct wind field plotted in the leftmost image.
Hopefully I will not make this mistake again…
Summary
If you want to plot wind vectors on a geographical map in NCL, follow these steps:
- Get the winds components rotated to Earth coordintates (regardless of the domain you’re trying to plot!)
- Disable auto-draw and frame progression
res@gsnDraw = Falseandres@gsnFrame = False - Create a map object using
map=gsn_csm_map(wks,res_map) - Use the
vector = gsn_csm_vector(wks,u,v,res_vec)to plot the winds - Overlay the vector image on your map
overlay(map,vector) - Draw the map
draw(map)and progress the frameframe(wks)
This is the important stuff, to get the basic plot right, then go ahead and waste a couple of hours figuring out which other plot resources are relevant/suitable. Yup, that’s NCL, when you think something will be hard to do it isn’t but when you think something is simple it is frustratingly complicated.
Subscribe via RSS


